The Wheel
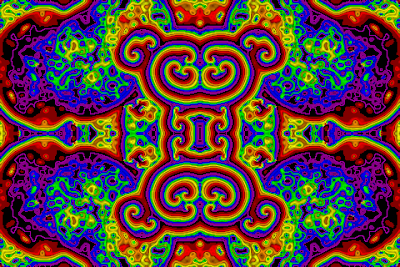
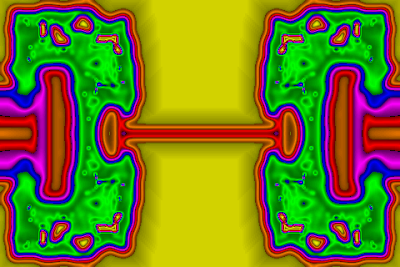
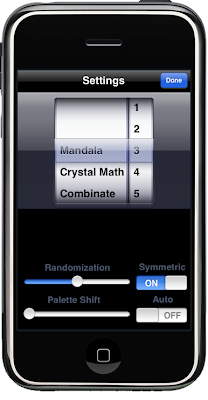 Visualizations: This is the largest control, and contains a list of the different visualizations available in Trancit. Each visualization is a unique math process, and generates a distinct graphical pattern. If you have been running with one visualization, such as "Mandala", and switch to another one, such as "Crystal Math", then you will see a gradual transition from one pattern to another.
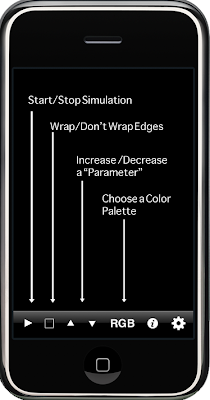
Parameters: Some visualizations have numbers associated with them. These are known as "parameters." The default value for a parameter produces interesting behavior in the visualization. If you select a lower number for the parameter, the visualization will calm down. If you select a high number, the visualization will get more energetic. The up- and down-pointing triangles on the toolbar in the main display control these same parameters. This gives you a way to adjust the energy of the visualization without having to switch to the Settings view.
Some rules, such as "Crystal Math" and "Tie Dye" have no parameters, and the rule "Combinate" has five parameters. Well discuss "Combinate" more in another posting.
Randomization
Beneath the wheel are two controls for randomly seeding the visualization. One is a slider titled "Randomization" and the other is a switch titles "Symmetric". Randomization means that random dots are placed in the display. This gives the visualization something to work with as a starting point, as well as a way to "spice things up" while a visualization is running. There are two ways to randomize:
- Double-tap when the visualization is displayed. This will clear the current image and randomize a blank screen
- Shake the iPhone (or iPod Touch) while the visualization is running. This will add random dots without clearing the screen.
The "Symmetric" switch controls how the random dots are placed on the screen. If this switch is set to "OFF", then the dots will be truly random. If the "Symmetric" switch is set to "ON", the the dots on the bottom will be a mirror image of the dots on the top, and the dots on the right will be a mirror image of the dots on the left. Symmetric randomization generates patterns that look more structured. Completely random patterns are beautiful too, just different from their more structured siblings.
Palette Shift
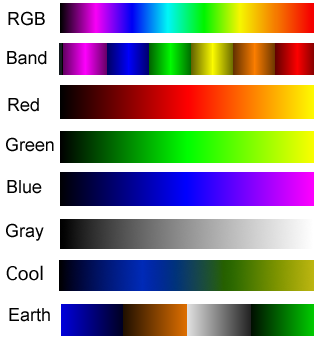
Trancit currently has eight different color palettes, and you select the one you want using the toolbar. A palette has a set of colors in a specific order (see the earlier posting on palettes). Shifting the palette maintains the order, but changes where the palette starts and finishes.
The slider: Let's take the "Earth" Palette as an example. Its colors are blue, brown, gray and green. If you move the "Palette Shift" slider from the default position on the left end, to the middle, then the colors in the Earth palette will now be ordered gray, green, blue and brown.
The order of colors makes a difference to the visualization, because every pixel is in a specific "state" at each point in time. The color palette assigns a color to each state. You can change the color palette without changing the state and get a very different image, as you may have experienced when you use the toolbar to switch palettes. Shifting the palette has a similar, but more subtle effect.
The "Auto" switch next to the Palette Shift slider makes this more interesting. If this switch is set to "ON", then the palette will shift automatically, by a little bit with each frame of the visualization. This adds extra energy to any visualization, and can sometimes change its character.
